Data Sets and Stimulus Sets
Perception in dynamic scenes: What is your Heider capacity?
The classic animation experiment by Heider and Simmel (1944) demonstrated our strong tendency to impose narrative on our perception and memory of interactions between simple geometric shapes. In their most famous animation with three simple shapes, observers almost inevitably interpreted them as rational agents with intention, desires and beliefs (“That nasty big triangle!”). Much work on dynamic scenes has identified basic visual properties that can make shapes seem animate. We created 30-second Heider-style cartoons with 3 to 9 items to investigate the limits on the ability to use narrative to understand animated scenes. Item trajectories were generated automatically by a simple set of rules, but without a script.
In Experiments 1 and 2, ten participants wrote short narratives for each cartoon. Next, different participants were shown a cartoon and then presented with one of the five highest scoring narratives: either one generated for that specific cartoon or one generated for a different cartoon having the same items. Participants made the decision about how well the description fit the cartoon on a scale from 1 (clearly does not fit) to 5 (clearly fits).
The details for the stimuli are presented below, and Heider-style cartoons are available for downloading by clicking on the appropriate search type at the bottom of the page. We hope that these cartoons can bring forth other interesting insights into our ability to understand dynamic scenes. If you use the stimuli, please tell your readers where you got them. We would be grateful to know about any inspirations you received from the cartoons. Please send us a note (jwolfe@bwh.harvard.edu).
Stimulus Details
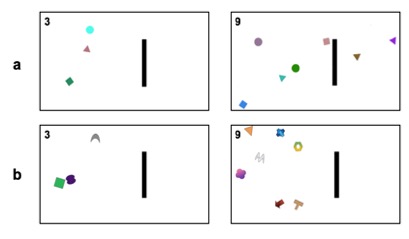
Figure 1. Screenshots from cartoons of different set sizes (indicated by the number on the top left corner) in (a) Experiment 1 and (b) Experiment 2.
Heider-style cartoons were created using Matlab and the Brainard/Pelli/Kleiner Psychtoolbox. In Experiment 1, each cartoon contained moving circles, squares and triangles of uniform size and a larger, unmoving black rectangle representing a wall or obstacle. We generated a total of 20 cartoons, populated by 3, 4, 5, 7 or 9 moving shapes or ‘characters’ (Figure 1a). There were four versions of cartoons created for each set size, each populated by the same characters, but with movements dictated by a unique combination of rules. Each cartoon was 30 seconds in length. The cartoons were generated and stored offline at https://osf.io/atc9x/..
The numbers of circles, squares and triangles were distributed as evenly as possible; i.e. if the set size was seven, there would be two of each shape, plus one extra of one of the shapes. Each shape was randomly assigned a unique color and a behavior from the following list: chasing, repulsion, attraction, moving to a corner of the screen (each corner of the screen was treated as a unique behavior) or a location on the screen, jittering, avoiding the stationary rectangle and random motion. Behaviors were selected with replacement. More information on the color and movement rules of the shapes can be found in Wick, F. A., Alaoui Soce, A., Garg, S., Grace, R. C., & Wolfe, J. M. (2019)..
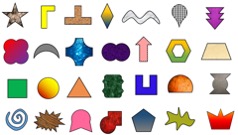
Figure 2. Distinct shapes used in Experiment 2
In Experiment 2, Heider-style cartoons contained distinct shapes instead of simple circles, squares and triangles used in Experiment 1. The cartoons were created using Matlab with Psychtoolbox using the same behavioral rules and set sizes described in Experiment1 (Figure 1b). Each set size was made up of a unique subset of shapes from Figure 2. These shapes were generated in Photoshop and the color/texture choices for the shapes were arbitrary. Additionally, all shapes were outlined in black to reduce bias due to contrast with the white background. If we assume a display of 53o x 31o, the shapes would subtend a visual angle of 2o x 1.5o-2.5o.
Stimuli
Folders for the movies created for Experiment 1 & 2 is available for download below.
Cartoons from Experiment 1 with circles, squares and triangles [.ZIP file]
Cartoons from Experiment 2 with distinct shapes [.ZIP file]
Narrative descriptions of the cartoons above are available in both a Word and Excel format below.
You can find the zip file containing both narrative documents here. [.ZIP file]
If you decide to work with these data, we would be interested to hear what you are up to. Please drop a note to wolfe@search.bwh.harvard.edu.