Data Sets and Stimulus Sets
What can 8,000 trials tell you about visual search?
Previous feature, conjunction, and spatial configuration search tasks have produced valuable information about mean reaction times and slopes. However, with only several hundred trials per subject, spread over several set sizes and divided between target-present and target-absent trials, there is only mediocre information about the distribution of the data. To address this issue, we have collected approximately 4000 trials from each of 9 subjects in a classic feature search task, 10 subjects in a classic conjunction search task, and 9 subjects in a spatial configuration search task.
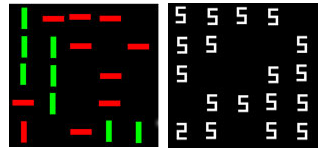
In the feature search task, subjects looked for a red vertical rectangle among green vertical rectangles. In the conjunction search task, subjects looked for a red vertical rectangle among green vertical and red horizontal rectangles. For the spatial configuration search task, subjects looked for a digital '2' among digital '5's. These stimuli share the same features, but differ in their organization. More specifically, the horizontal components of the 2s and the 5s remained the same, but the positions of the vertical features differ, resulting in a change in the locations of the lines.
The details for the stimuli and method are presented below, and these three datasets are available for downloading by clicking on the appropriate search type at the bottom of the page. We hope that these data can be a test bed for models of visual search. If you usethe data, please tell your readers where you got it. We would be grateful to know about any interesting facts that you might dig out of these 80,000 trials. Please send us a note (jwolfe@bwh.harvard.edu).Thank you to AFOSR for suppporting these studies.
Stimulus Details
All three sets of stimuli were created using MATLAB and the Brainard/Pelli Psych Toolbox. A central fixation point in the shape of a white cross appeared in the center of the screen before stimulus onset for all experiments. At the viewing distance of 57.4 cm, a 22.5° square region of a Macintosh computer screen was divided into an invisible 5 x 5 array of cells. Each stimulus was placed at a random location within a cell. For the spatial configuration search, the stimuli were white 2s(target) and 5s (distractor) and each subtended a visual angle of 1.5° x 2.7°. For the conjunction search, targets were red vertical bars among red horizontal and green vertical bars. Each bar subtended 3.5° x 1 ° visual angle. For the feature search, targets were red vertical bars with the same size and luminance profiles as the conjunction search task.
Data Collection
Data from 9-10 Ss was collected separately for the feature, conjunction and spatial configuration searches. The method remained the same for all three experiments. The task was to press one key if the target was present and another if the target was absent. The target was present on 50% of the trials, determined stochastically on each trial. Subjects were instructed to respond as quickly as possible while minimizing errors. Subjects were tested in 12 blocks of 30 practice and 300 experimental trials and 1 block of 30 practice and 400 experimental trials for a grand total of 4000 experimental trials and 390 practice trials. Reaction time was measured at set sizes 3, 6, 12, and 18. Subjects were given feedback after each trial.
Fitting Function
One of the ways that we have analyzed the abov data sets is by fitting several popular distribution functions to them. Below, we present the fitting function code for the ex-Gaussian, ex-Wald, shifted Gamma, and Weibull functions. Each package of functions contains several components necessary to compute the function fits in Matlab. These functions require that the Statistics Toolbox for Matlab is installed.
We also include two functions, getrtdata.m and getrawdata.m, that can quickly grab the RT data from any subject and condition from these experiments (via the included .txt data files). The function getrtdata.m draws RTs from truncated distributions with RTs < 200 ms > 4000 ms removed for the feature and conjunction search tasks and < 200 ms and > 8000 ms removed for the spatial configuration task. The function getrawdata.m returns data sets with no truncation.
Header files contain authorship information about the code since it was pieced together from several sources. You can direct questions about the code to evan.palmer@wichita.edu.
Data Sets
The three data sets available for downloading have 8 labeled fields each. The columns are labeled as subject, cond report, trialdigit, set size, target present, error, message, and reaction time in msec
- Sinit are subject identifiers,
- BlockReport distinguishes practice from experimental trials
- Cond report refers to the type of search and remains uniform over each data set. Feature search is referred to as RVvGV, conjunction as RVvRHGV, and spatial configuration is 2_v_5.
- Trialdigit shows the order in which the subjects completed each trial,
- YN(stimulus) is 1 for a target present trial, 0 for target absent,
- Set size refers to the total number of items on the screen (3, 6, 12, or 18)
- Response codes the response key (40 = target present response, 1 = target absent) it is redundant with PresAbsResponse,
- PresAbsResponse 1=target present response, 0 = 1=target absent,
- Target present field is 1 when the target was present and 0 when the target was absent.
- Error field is 0 when the Ss responded correctly and 1 for incorrect responses.
- Message explains the outcome of the trials (and reproduces the Feedback information given to the subject). Specifically, trials are labeled as HIT (target present correct trials), TNEG (True negative -trial absent correct trials), MISS (target present incorrect trials) and FA (False alarm - target absent incorrect trials).
Practice trials are not included in this dataset. The number of trials for each subject may deviate slightly from 4000 because the subjects could take breaks by pressing the space bar instead of responding. These trials were not recorded and not replaced. Otherwise, these are unfiltered data. For example, we have not defined as errors any of the very long RTs or very short RTs. You may make your own decisions about these matters.
FEATURE SEARCH [CSV]
CONJUNCTION SEARCH [CSV]
SPATIAL CONFIGURATION SEARCH [CSV]
WHAT CAN 1,000,000 TRIALS TELL US ABOUT VISUAL SEARCH?
The data reported here were the basis for Wolfe, J. M. (1998). What do 1,000,000 trials tell us about visual search? Psychological Science, 9(1), 33-39.
What is in the data set?
These results represent the slopes of RT x Set Size functions for individual participants in a wide range of experimental conditions. 25yrs + after the publication, it would be very hard to recover many of the details of specific experiments.
The slopes come from experiments with the following general characteristics. Observers were told to look for a specific target item during a block of 300-500 trials. A target was present on 50% of the trials. The display was visible until the subject responded. Subjects were asked to respond as quickly and as accurately as possible. Error rates (which will not be presented) were almost always less than 10%, with the majority less than 5%. Three or more set sizes were randomly intermixed during a block of trials. Set sizes ranged varied widely across experiments. In a standard experiment, ten subjects were tested, yielding ten target-present and ten target-absent slopes. Some studies had fewer subjects, others more, but ten is the modal value. Subjects were generally young (18-30). All had normal or corrected to normal acuity and could pass the Ishihara color test. Testing was binocular. An average subject would have had limited practice in visual search tasks (several hundred trials).
The column of the datafile are:
- Lab – just says wolfelab
- Exp. Name – these are names by which we referred to the experiment in the lab. The name might be informative (eg orcol would be an orientation X color conjunction task) but, I fear, most of the names will be rather cryptic. Writing in 2024, I am something of a loss for many of them.
- CATEGORY – This is more informative
- – Feature: target is defined by a single “preattentive” feature (e.g. color, orientation)
- – Hard feature: target is defined by a single “preattentive” feature but either that is a weak feature (e.g. curvature) or a difficult case of an otherwise easy feature. (e.g. vertical among tilted left and right oriented lines)
- – Conj = conjunction: target is defined by the combination of two (or more) preattentive features (e.g. red vertical target among green vertical and red horizontal distractors)
- – ColCol: Color X Color conjunctions (e.g. a red-green item among red-yellow and yellow-green)
- – Serial (or “spatial configuration”): typically, in this set, search for T among Ls or digital 2 among 5s.
- – Other: well, these are other tasks.
- Target – Slope of RT x Setsize function for correct target present trials, probably with RT outliers removed.
- Blank – Slope of RT x Setsize function for correct target absent trials, probably with RT outliers removed.
- Ratio – Absent Slope / Present Slope
If you decide to work with these data, we would be interested to hear what you are up to. Please drop a note to wolfe@search.bwh.harvard.edu.